Experiment NO.: 01
Title: The study of diode characteristics (V-I characteristics)
Objective:
- To study the I-V characteristics of silicon p-n junction diodes.
Equipments:
- p-n junction diode
- Resistor
- Chords and wire
- Multimeter
- DC power supply
Theory :
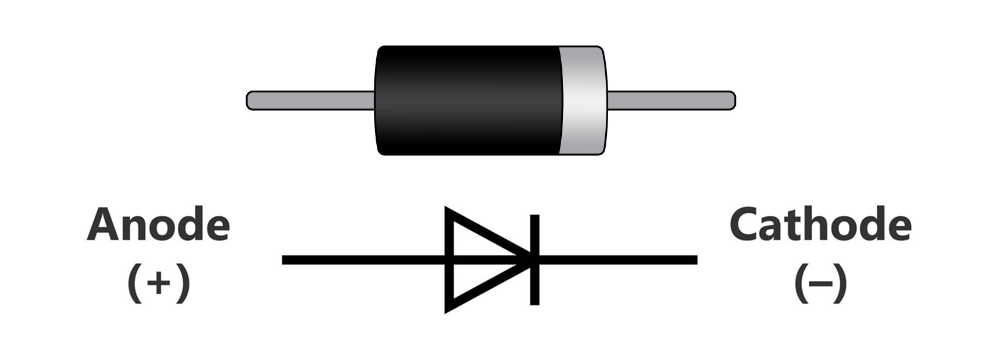
A diode is a two terminal semiconductor device which allows current to flow through it is only one direction. The symbol of diode in a circuit diagram is as follows:
Current flows from anode to the cathode side:
P-type silicon : when an intrinsic silicon semiconductor is doped with Al impurities. It becomes P-type. At thermal equilibrium.
p0 = NA and n0 = ni²/NA
p0=hole concentration, n0=electron concentration.
NA=acceptor atoms, intrinsic =ni=1.5×10^10 cm−3 (si)
N-type silicon: When an intrinsic silicon semiconductor is doped with p (phosphorous) impurities it becomes n-type. At thermal equilibrium:
n0= ND and P0 =ni²/ND.
Current-Voltage Characteristics:
There are three area of operation–
* The forward –bias region (V>0)
* The reverse –bias region (V<0)
* The breakdown region
Procedure:
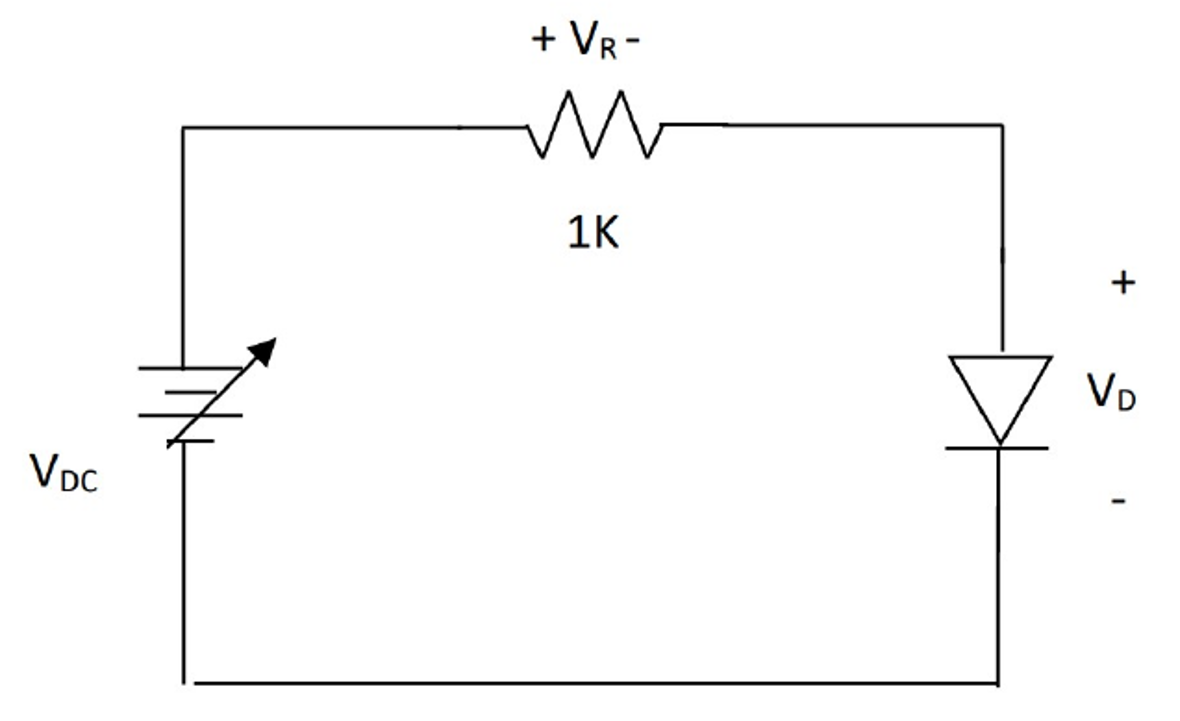
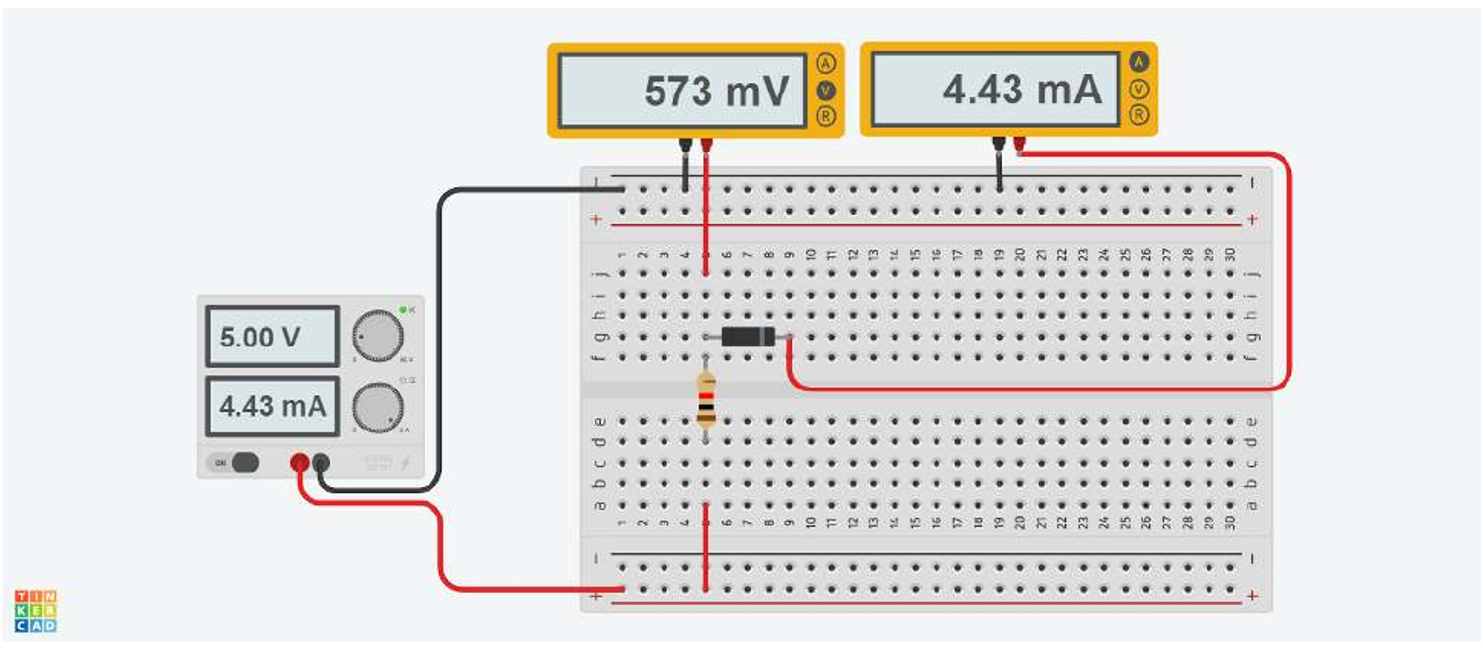
- We simulated the circuit using TinkerCAD to observe the diode behavior.
- The diode was connected in forward bias.
- A variable DC power supply was used to apply the input voltage (\(V_{DC}\)).
- The supply voltage was varied gradually from 0.1 V, 0.2 V, 0.3 V … up to 25 V.
-
For each applied voltage, we measured and recorded:
-
the voltage drop across the diode (\(V_D\)), and
- the current through the diode (\(I_D\)).
- The recorded values were tabulated in a data table.
- Finally, the data was plotted using Matplotlib (Python library) to visualize the I–V characteristics of the diode.
Data table:
| Reading No. | Vdc (V) | Vd (V) | Vr (V) = Vdc – Vd | Id (mA) |
|---|---|---|---|---|
| 1 | 0.00 | 0.000 | 0.000 | 0.000 |
| 2 | 0.20 | 0.200 | 0.000 | 0.000 |
| 3 | 0.40 | 0.400 | 0.000 | 0.000 |
| 4 | 0.60 | 0.480 | 0.120 | 0.120 |
| 5 | 0.80 | 0.503 | 0.297 | 0.297 |
| 6 | 1.00 | 0.516 | 0.484 | 0.484 |
| 7 | 1.20 | 0.525 | 0.675 | 0.675 |
| 8 | 1.40 | 0.531 | 0.869 | 0.869 |
| 9 | 1.60 | 0.536 | 1.064 | 1.060 |
| 10 | 1.80 | 0.541 | 1.259 | 1.260 |
| 11 | 2.00 | 0.544 | 1.456 | 1.460 |
| 12 | 2.20 | 0.548 | 1.652 | 1.650 |
| 13 | 3.00 | 0.558 | 2.442 | 2.440 |
| 14 | 4.00 | 0.566 | 3.434 | 3.430 |
| 15 | 5.00 | 0.573 | 4.427 | 4.430 |
| 16 | 6.00 | 0.578 | 5.422 | 5.420 |
| 17 | 8.00 | 0.586 | 7.414 | 7.410 |
| 18 | 10.00 | 0.592 | 9.408 | 9.410 |
| 19 | 12.00 | 0.597 | 11.403 | 11.400 |
| 20 | 15.00 | 0.603 | 14.397 | 14.400 |
| 21 | 18.00 | 0.608 | 17.392 | 17.400 |
| 22 | 20.00 | 0.611 | 19.389 | 19.400 |
| 23 | 22.00 | 0.614 | 21.386 | 21.400 |
| 24 | 25.00 | 0.617 | 24.383 | 24.400 |
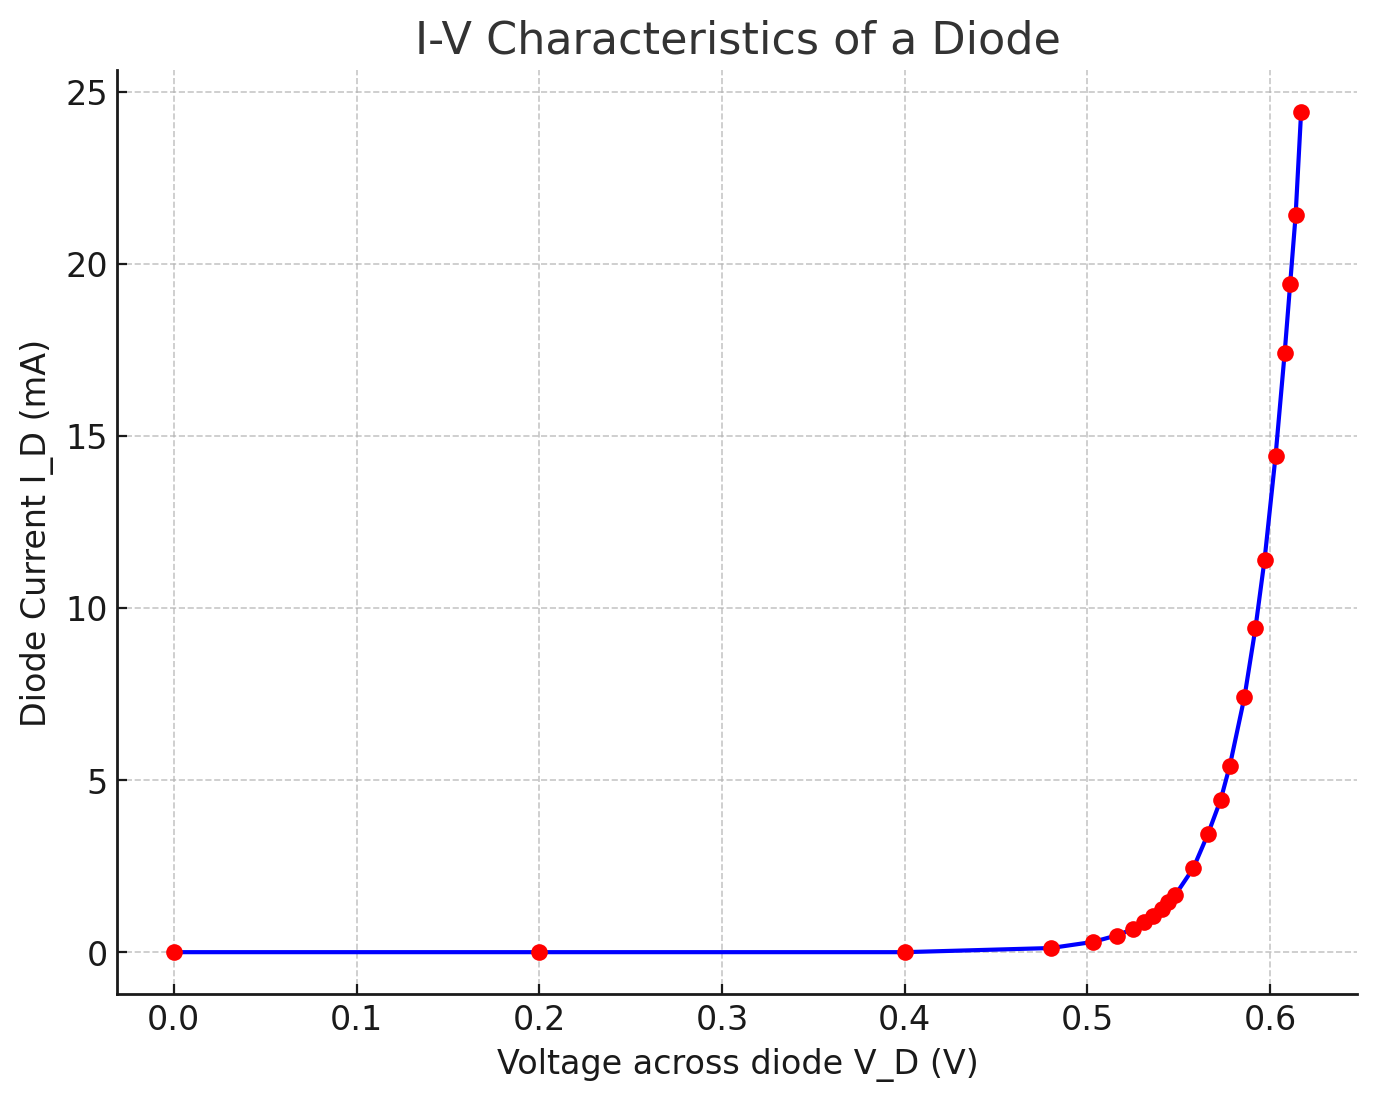
Result:
The graph has been plotted between voltage and current. It is in attachment.
Discussion:
The diodes don’t work in reverse bias (RB) but forward bias (FB).
Precautions:
(i) Ammeter and voltmeter should be connected is series and parallel.
(ii) Connection should be proper in the circuit with switch off mode.